For the new year I will change the format slightly and post a chart of a top performing ETF from the list of ETFs in performance table below the chart. For the first day of this new year the ETF UWM was up the most up 3.63% breaking out of a bullish flag formation. This is a double leveraged ETF fund based on the Russell 2000small cap index which lead the market to the upside last year and is still showing signs that the rally is continuing into the new year. The blue line is the 20 day moving average and the red line is the 50 day moving average. A good place to buy in an up trend is between the two moving averages on a pull back. Click on chart to enlarge.

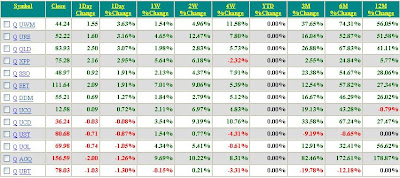
The table below lists the ETFs that I am tracking and is sorted by largest percent change for 1 day. Note the YTD column is reset to 0. Click on table to enlarge.


![[Most Recent Quotes from www.kitco.com]](http://www.kitconet.com/charts/metals/base/copper-d.gif)
![[Most Recent Quotes from www.kitco.com]](http://www.kitconet.com/charts/metals/gold/t24_au_en_usoz_2.gif)
![[Most Recent Quotes from www.kitco.com]](http://www.kitconet.com/charts/metals/silver/t24_ag_en_usoz_2.gif)

No comments:
Post a Comment