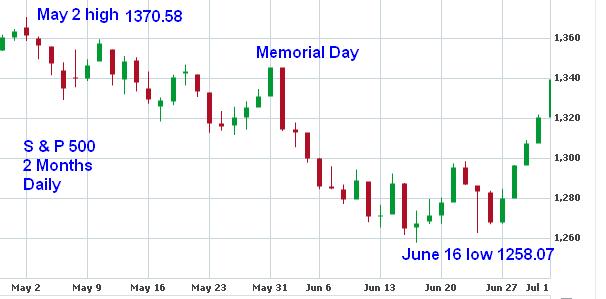
There is a pattern in which the market makes a rally into a 3-day weekend and then reverses on Tuesday as happened last Memorial Day weekend when the market rallied up to May 30 and then reversed June 1 continuing the down trend that began with the May 2 high of 1370.58. So far the low 1258.07 on June 16 has held for more than 2 weeks and the question is with price at 1339.67 will we make new highs to take out the May 2 high or have another long weekend reversal to take out former lows? The chart below of the S & P 500 two month daily shows recent market action. Click on chart to enlarge.

On a longer time frame the monthly chart below shows that if the June 16 low holds that we will have made a 4th wave bottom on the monthly chart. Note how the last two red candles on the monthly for May and June both formed Hammer Candlesticks which is very bullish and that should the market take out the high of last month June at the 1365 area it should be off to the races as the market rallies higher. Click on chart to enlarge.


![[Most Recent Quotes from www.kitco.com]](http://www.kitconet.com/charts/metals/base/copper-d.gif)
![[Most Recent Quotes from www.kitco.com]](http://www.kitconet.com/charts/metals/gold/t24_au_en_usoz_2.gif)
![[Most Recent Quotes from www.kitco.com]](http://www.kitconet.com/charts/metals/silver/t24_ag_en_usoz_2.gif)
